Note
Go to the end to download the full example code.
Distilled Conditional Randomization Test (dCRT) using Lasso vs Random Forest learners#
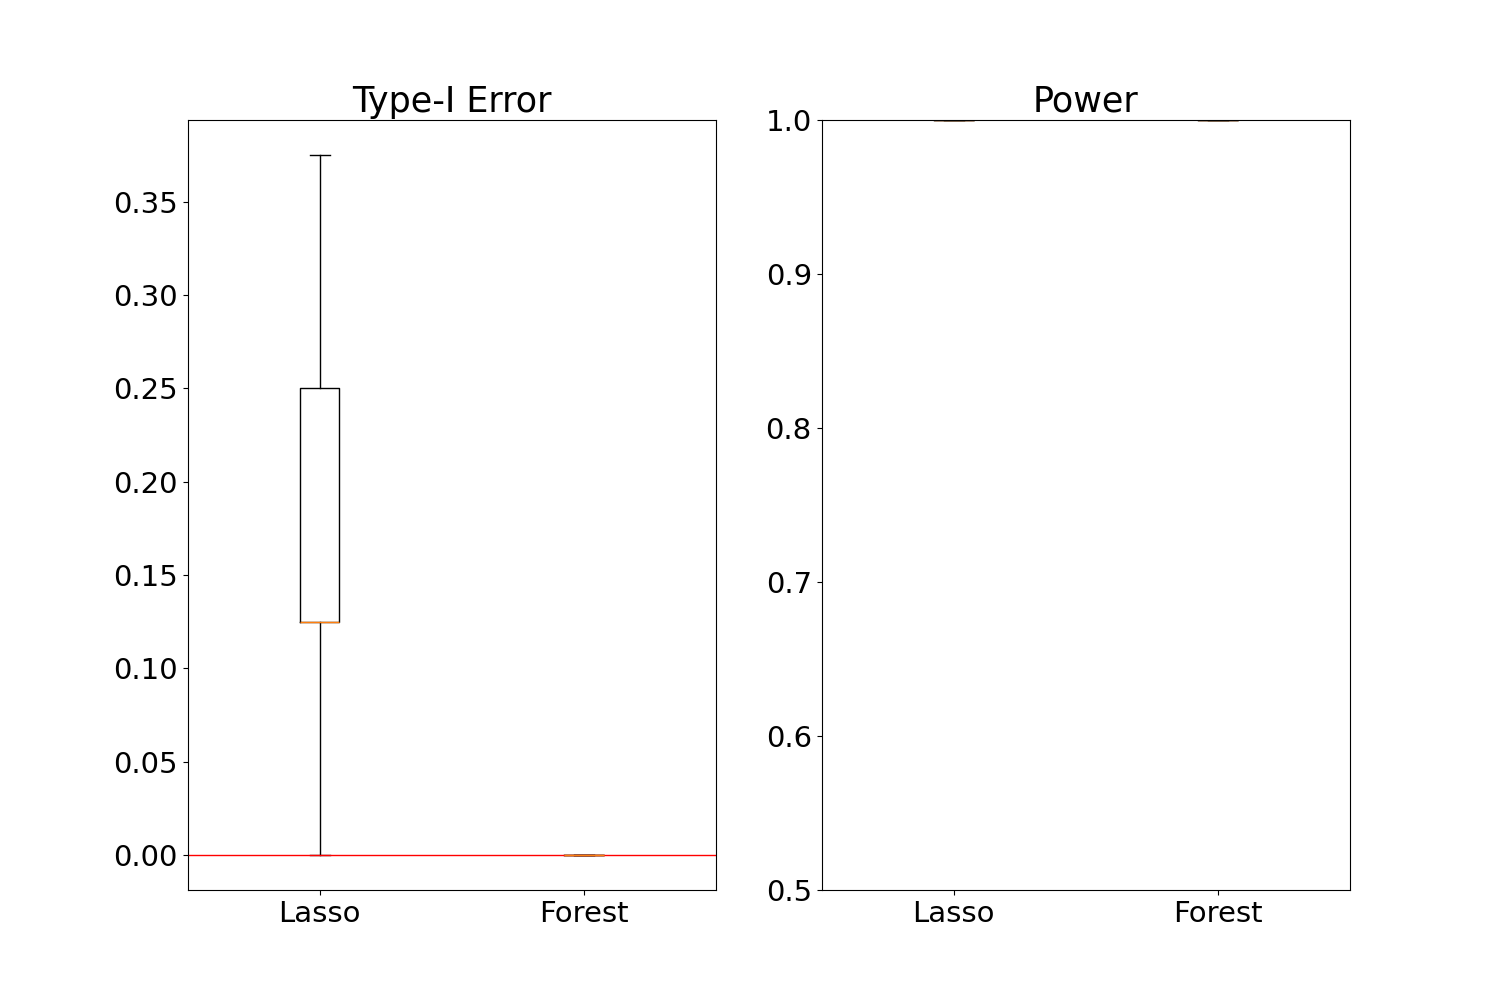
This example compares the performance of d0crt based on the lasso (1) and random forest (2) implementations. The number of repetitions is set to 10. The metrics used are the type-I error and the power
Imports needed for this script#
import matplotlib.pyplot as plt
import numpy as np

from hidimstat.dcrt import dcrt_zero
from hidimstat.scenario import multivariate_1D_simulation

plt.rcParams.update({"font.size": 21})

typeI_error = {"Lasso": [], "Forest": []}
power = {"Lasso": [], "Forest": []}
Processing the computations#
for sim_ind in range(10):
    print(f"Processing: {sim_ind+1}")
    np.random.seed(sim_ind)

    # Number of observations
    n = 1000
    # Number of variables
    p = 10
    # Number of relevant variables
    n_signal = 2
    # Signal-to-noise ratio
    snr = 4
    # Correlation coefficient
    rho = 0.8
    # Nominal false positive rate
    alpha = 5e-2

    X, y, _, __ = multivariate_1D_simulation(
        n_samples=n, n_features=p, support_size=n_signal, rho=rho, seed=sim_ind
    )

    # Applying a reLu function on the outcome y to get non-linear relationships
    y = np.maximum(0.0, y)

    ## dcrt Lasso ##
    results_lasso = dcrt_zero(X, y, screening=False, verbose=True)
    typeI_error["Lasso"].append(
        sum(results_lasso[1][n_signal:] < alpha) / (p - n_signal)
    )
    power["Lasso"].append(sum(results_lasso[1][:n_signal] < alpha) / (n_signal))

    ## dcrt Random Forest ##
    results_forest = dcrt_zero(
        X, y, screening=False, statistic="randomforest", verbose=True
    )
    typeI_error["Forest"].append(
        sum(results_forest[1][n_signal:] < alpha) / (p - n_signal)
    )
    power["Forest"].append(sum(results_forest[1][:n_signal] < alpha) / (n_signal))
Processing: 1
Processing: 2
Processing: 3
Processing: 4
Processing: 5
Processing: 6
Processing: 7
Processing: 8
Processing: 9
Processing: 10
Plotting the comparison#
fig, ax = plt.subplots(nrows=1, ncols=2, figsize=(15, 10))
ax[0].set_title("Type-I Error")
ax[0].boxplot(typeI_error.values())
ax[0].set_xticklabels(typeI_error.keys())
ax[0].axhline(linewidth=1, color="r")

ax[1].set_title("Power")
ax[1].boxplot(power.values())
ax[1].set_xticklabels(power.keys())
ax[1].set_ylim(0.5, 1)

plt.show()

Total running time of the script: (1 minutes 2.967 seconds)
Estimated memory usage: 212 MB
