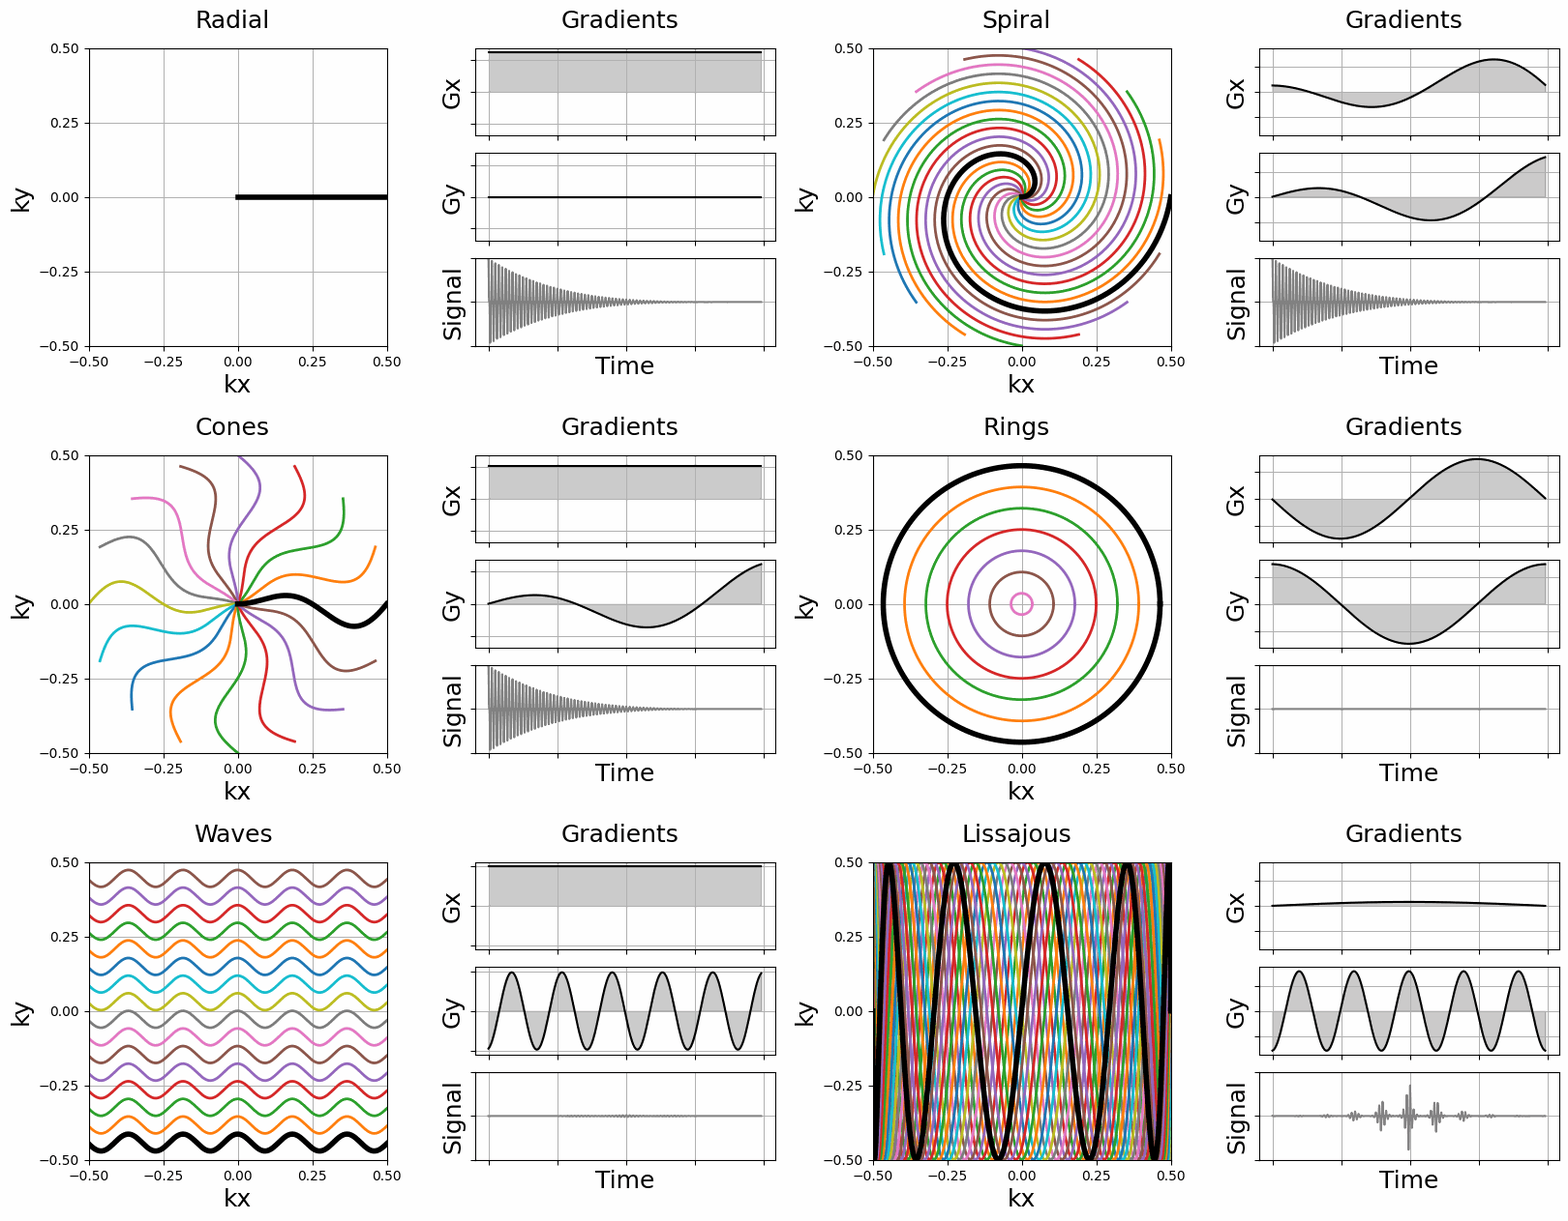
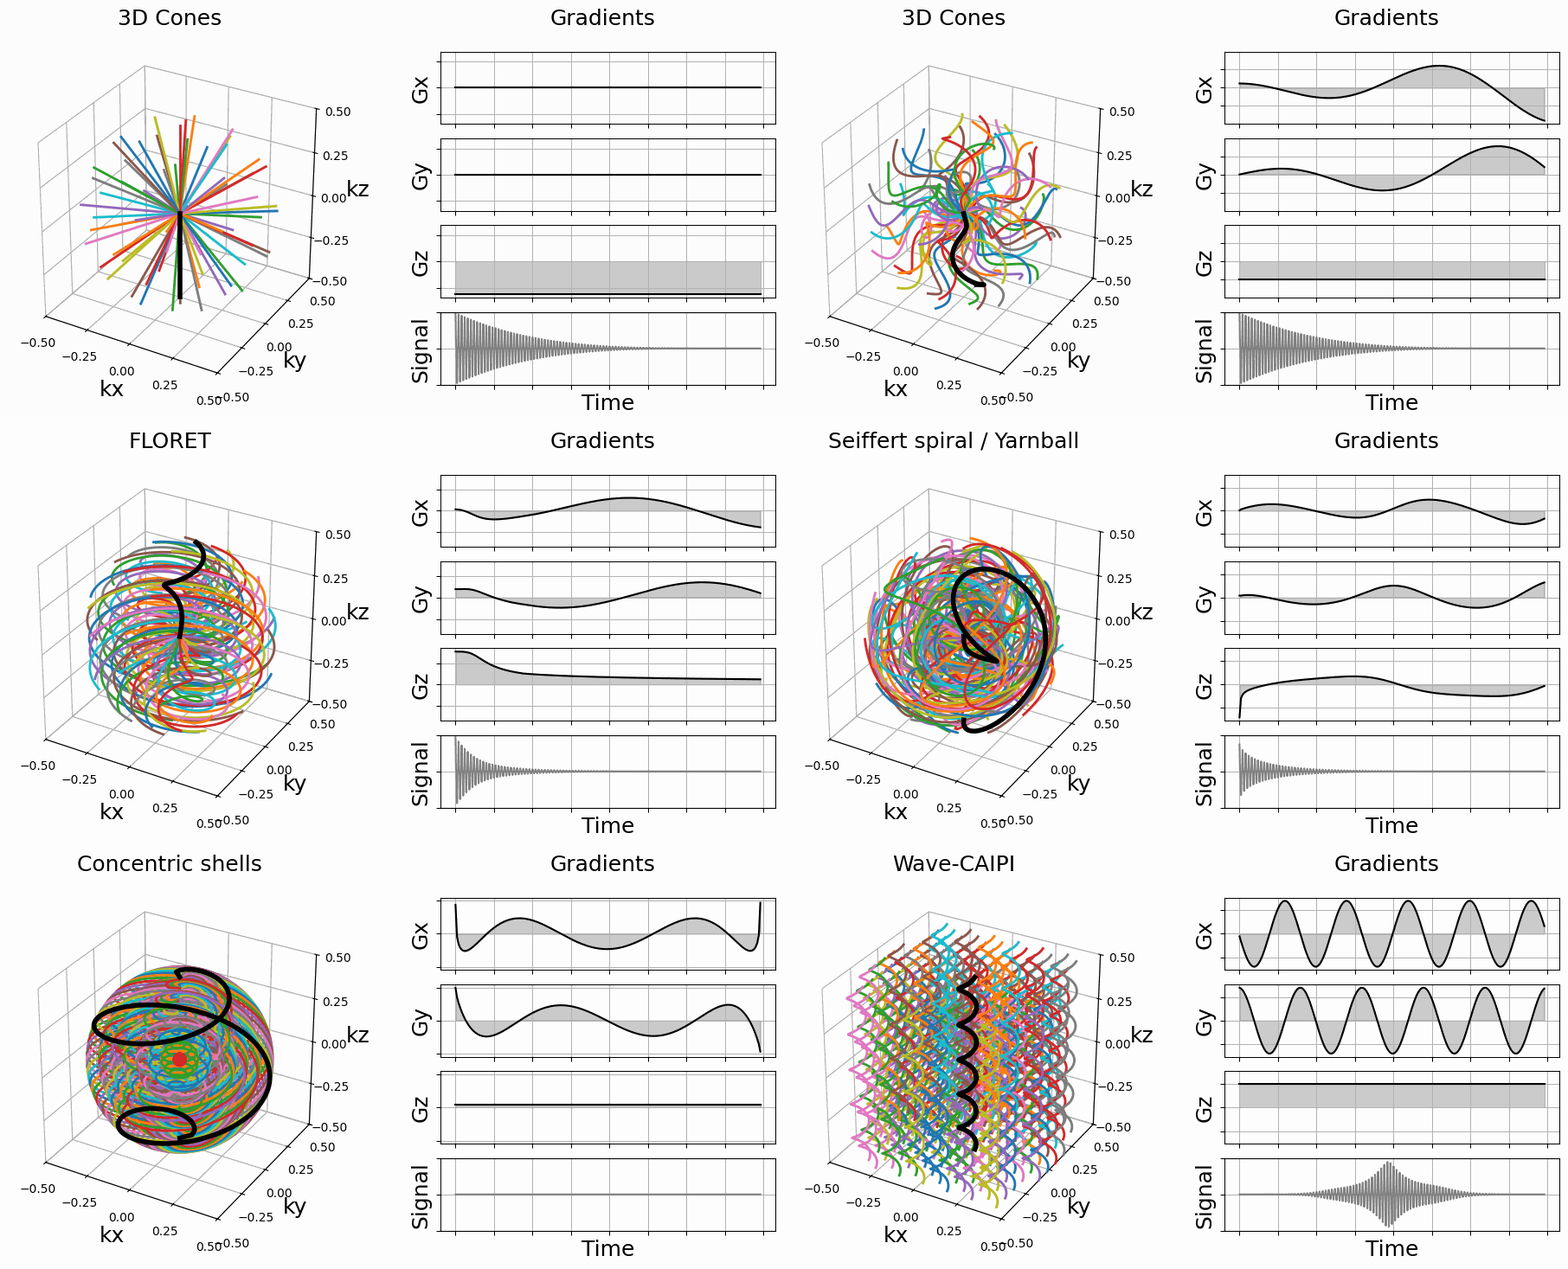
display_gradients_simply#
- mrinufft.trajectories.display.display_gradients_simply(trajectory: ndarray[tuple[int, ...], dtype[_ScalarType_co]], shot_ids: Sequence[int, ...] = (0,), figsize: float = 5, fill_area: bool = True, uni_signal: str | None = 'gray', uni_gradient: str | None = None, subfigure: Figure | Sequence[Axes, ...] | None = None) tuple[Axes][source]#
Display gradients based on trajectory of any dimension.
- Parameters:
trajectory (NDArray) – Trajectory to display.
shot_ids (tuple[int, ...], optional) – Indices of the shots to display. The default is [0].
figsize (float, optional) – Size of the figure.
fill_area (bool, optional) – Fills the area under the curve for improved visibility and representation of the integral, aka trajectory. The default is True.
uni_signal (str or None, optional) – Define whether the signal should be represented by a unique color given as argument or just by the default color cycle when None. The default is “gray”.
uni_signal – Define whether the gradients should be represented by a unique color given as argument or just by the default color cycle when None. The default is None.
subfigure (plt.Figure, optional) – The figure where the trajectory should be displayed. The default is None.
- Returns:
axes – Axes of the figure.
- Return type:
plt.Axes


