Note
Go to the end to download the full example code. or to run this example in your browser via Binder
Stacked NUFFT operator#
An example to show how to setup a stacked NUFFT operator.
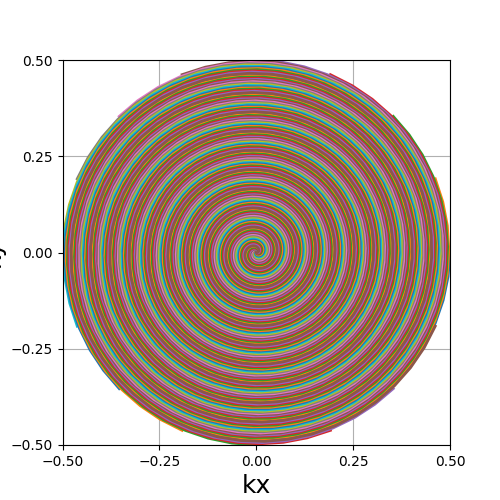
This example shows how to use the stacked NUFFT operator to reconstruct data when the sampling pattern in k-space is a stack of 2D non-Cartesian trajectories. Hereafter a stack of 2D spirals is used for demonstration.
import matplotlib.pyplot as plt
import numpy as np

from mrinufft import display_2D_trajectory

plt.rcParams["image.cmap"] = "gray"
Data preparation#
Image loading#
For realistic 3D images we will use the BrainWeb dataset,
installable using pip install brainweb-dl.

Trajectory generation#
Only the 2D pattern needs to be initialized, along with its density to improve the adjoint NUFFT operation and the location of the different slices.

Operator setup#
from mrinufft.operators.stacked import MRIStackedNUFFT

stacked_nufft = MRIStackedNUFFT(
    samples=2 * np.pi * samples,  # normalize for finufft
    shape=mri_data.shape,
    z_index=kz_slices,
    backend="finufft",
    n_coils=1,
    smaps=None,
    density=density,
)

kspace_stack = stacked_nufft.op(mri_data)
print(f"K-space shape: {kspace_stack.shape}")

mri_data_adj = stacked_nufft.adj_op(kspace_stack)
mri_data_adj = np.squeeze(abs(mri_data_adj))
print(f"Volume shape: {mri_data_adj.shape}")
K-space shape: (1, 1, 1448000)
Volume shape: (181, 217, 181)
fig2, ax2 = plt.subplots(1, 3, figsize=(10, 3))
ax2[0].imshow(mri_data_adj[90, :, :])
ax2[1].imshow(mri_data_adj[:, 108, :])
ax2[2].imshow(mri_data_adj[:, :, 90])
plt.show()

Total running time of the script: (0 minutes 12.908 seconds)
