
Note
Go to the end to download the full example code. or to run this example in your browser via Binder
Trajectory display configuration#
An example to show how to customize trajectory displays.
The parameters presented here can be tuned to your own taste and needs
by using displayConfig.
import matplotlib as mpl
import matplotlib.pyplot as plt
import numpy as np

from mrinufft import display_2D_trajectory, display_3D_trajectory, displayConfig
from mrinufft.trajectories import conify, initialize_2D_spiral
Script options#
These options are used in the examples below to define trajectories and display options.
# Trajectory parameters
Nc = 120  # Number of shots
Ns = 500  # Number of samples per shot

# Display parameters
figure_size = 10  # Figure size for trajectory plots
subfigure_size = 6  # Figure size for subplots
one_shot = -5  # Highlight one shot in particular
def show_traj(traj, name, values, **kwargs):
    fig, axs = plt.subplots(
        1,
        len(values),
        figsize=(subfigure_size * len(values), subfigure_size),
        subplot_kw={"projection": "3d"},
    )
    for ax, val in zip(axs, values):
        with displayConfig(**{name: val}):
            display_3D_trajectory(traj, subfigure=ax, **kwargs)
            ax.set_title(f"{name}={val}", fontsize=2 * subfigure_size)
    plt.show()
Trajectory displays#
The following trajectory will be used to showcase the display parameters. The trajectory parameters are explained in the 3D Trajectories example.
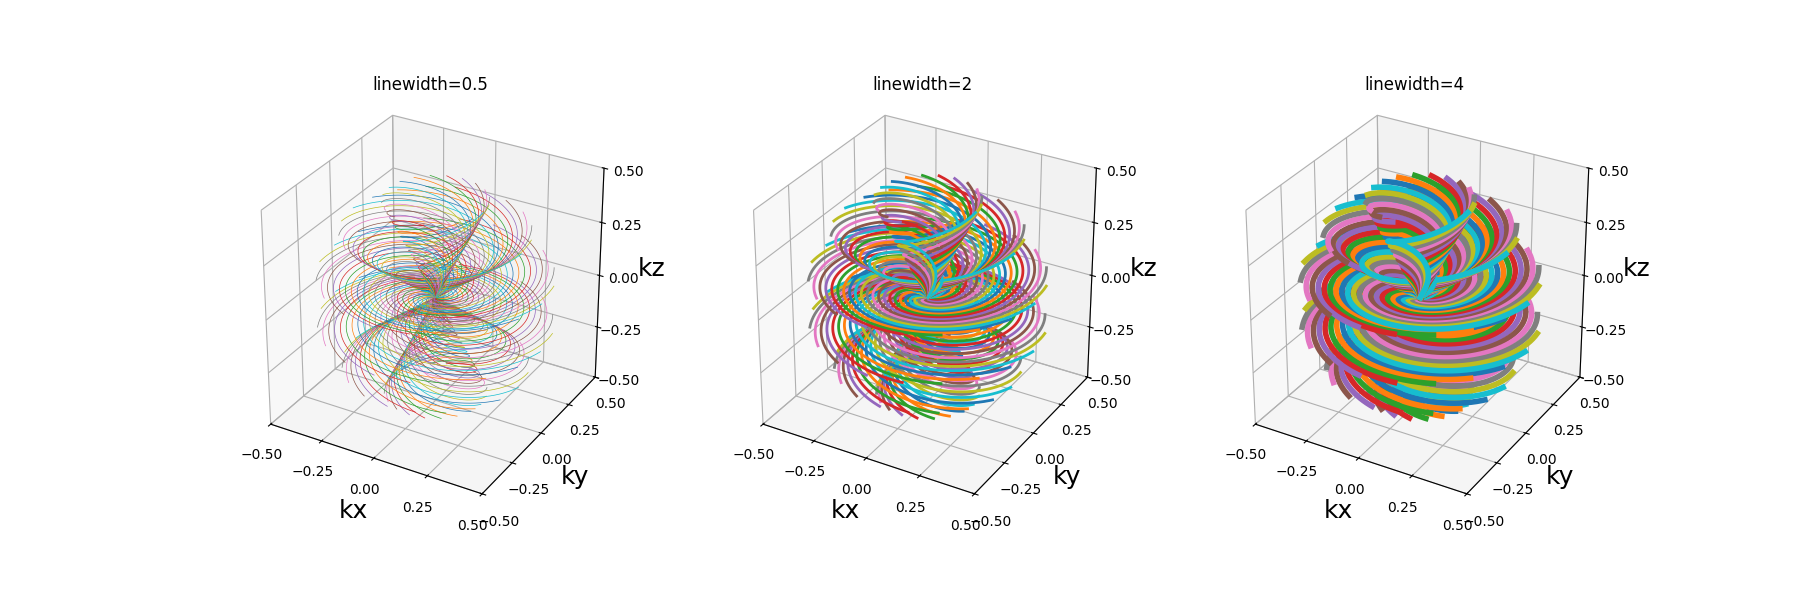
linewidth#
The linewidth corresponds to the curve thickness, and can be changed
to improve the shots visibility.
show_traj(traj, "linewidth", [0.5, 2, 4])
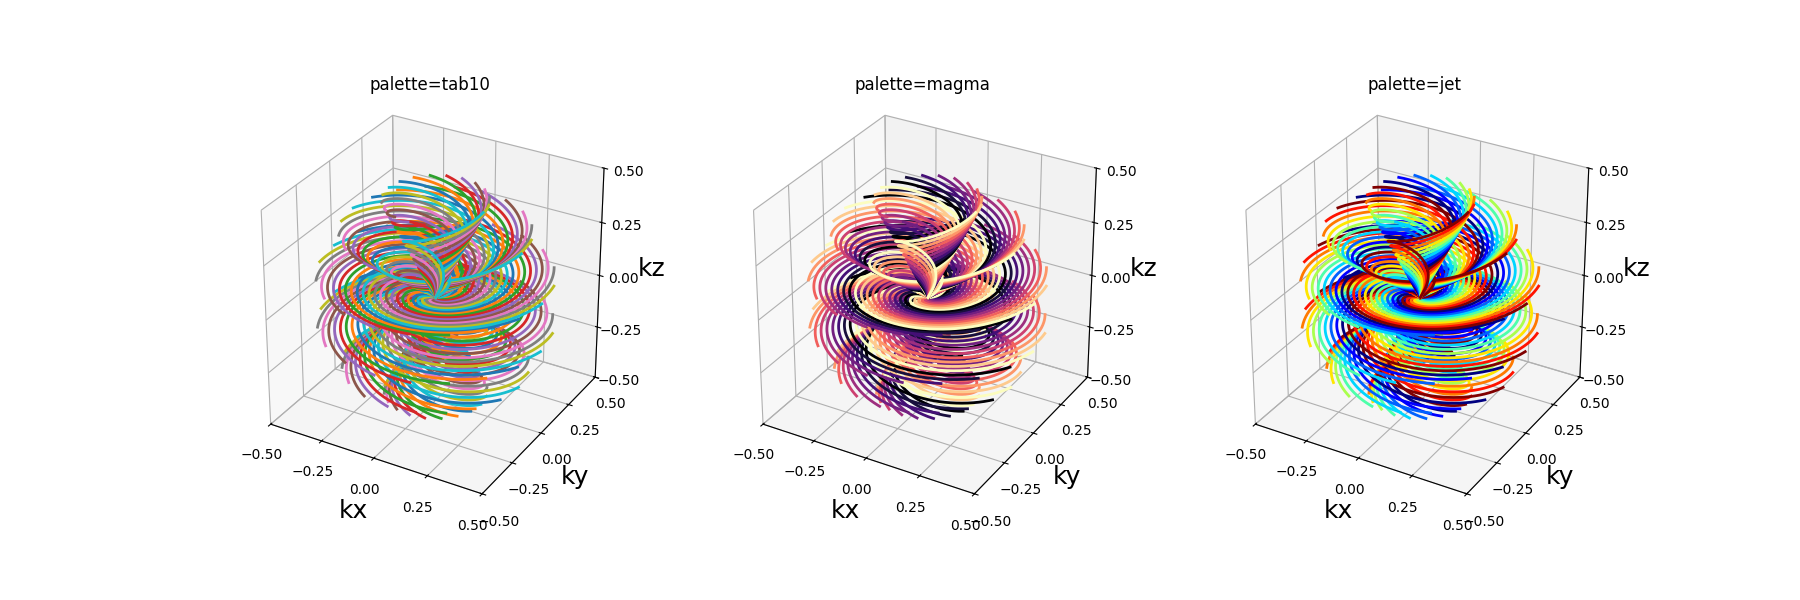
palette#
The palette parameter allows you to change the color of the shots.
show_traj(traj, "palette", ["tab10", "magma", "jet"])
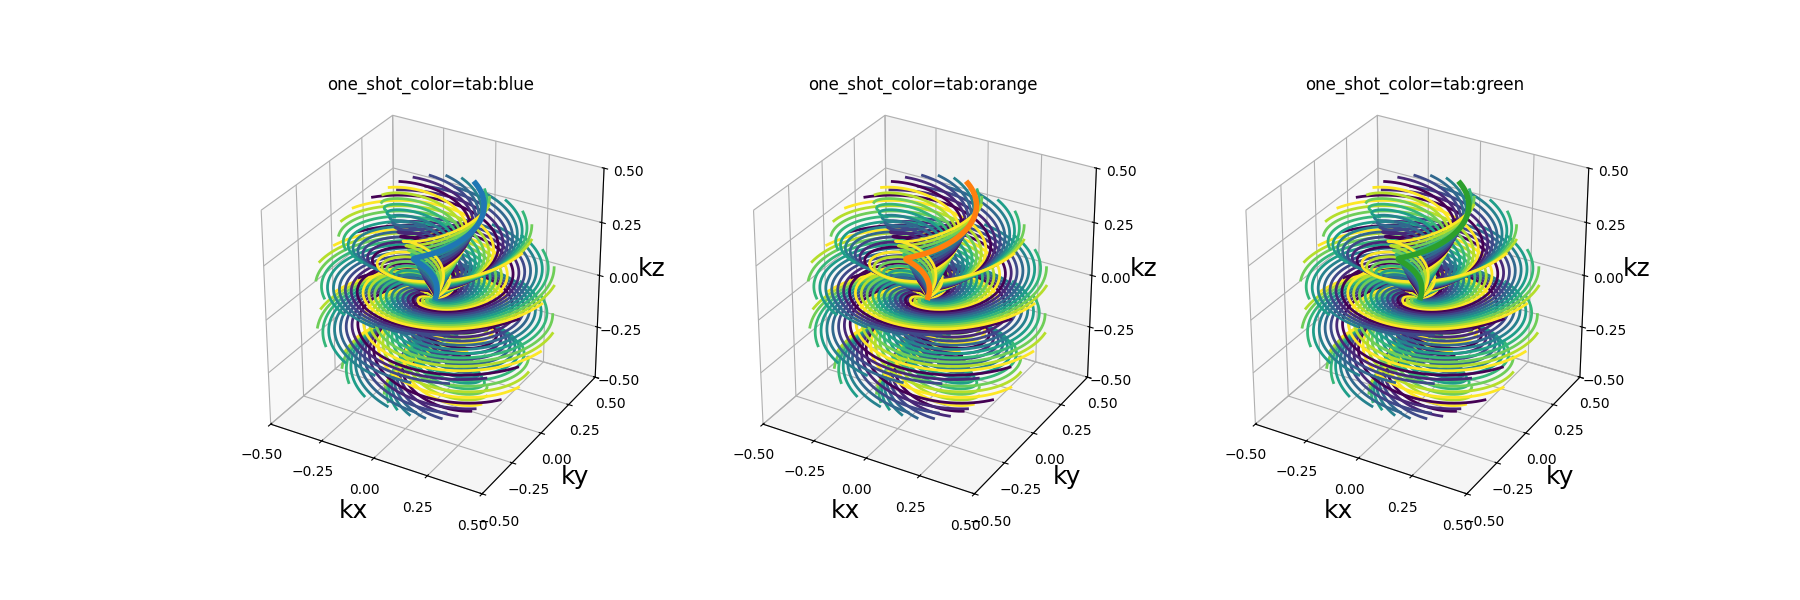
one_shot_color#
The one_shot_color parameter is used to highlight one shot in particular
with a specified color.
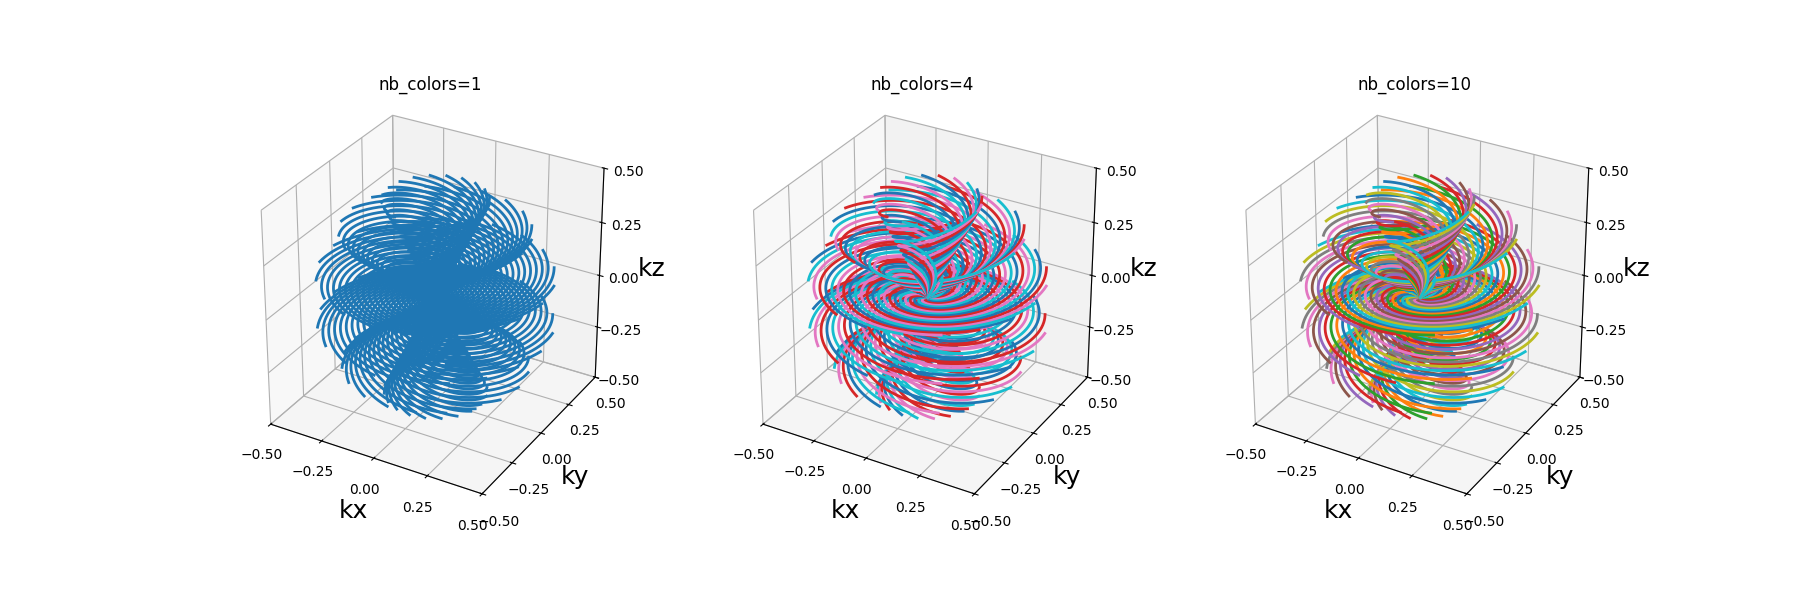
nb_colors#
The nb_colors parameter allows you to change the number of colors used from the
specified color palette to display the shots.
show_traj(traj, "nb_colors", [1, 4, 10])
Labels, titles and legends#
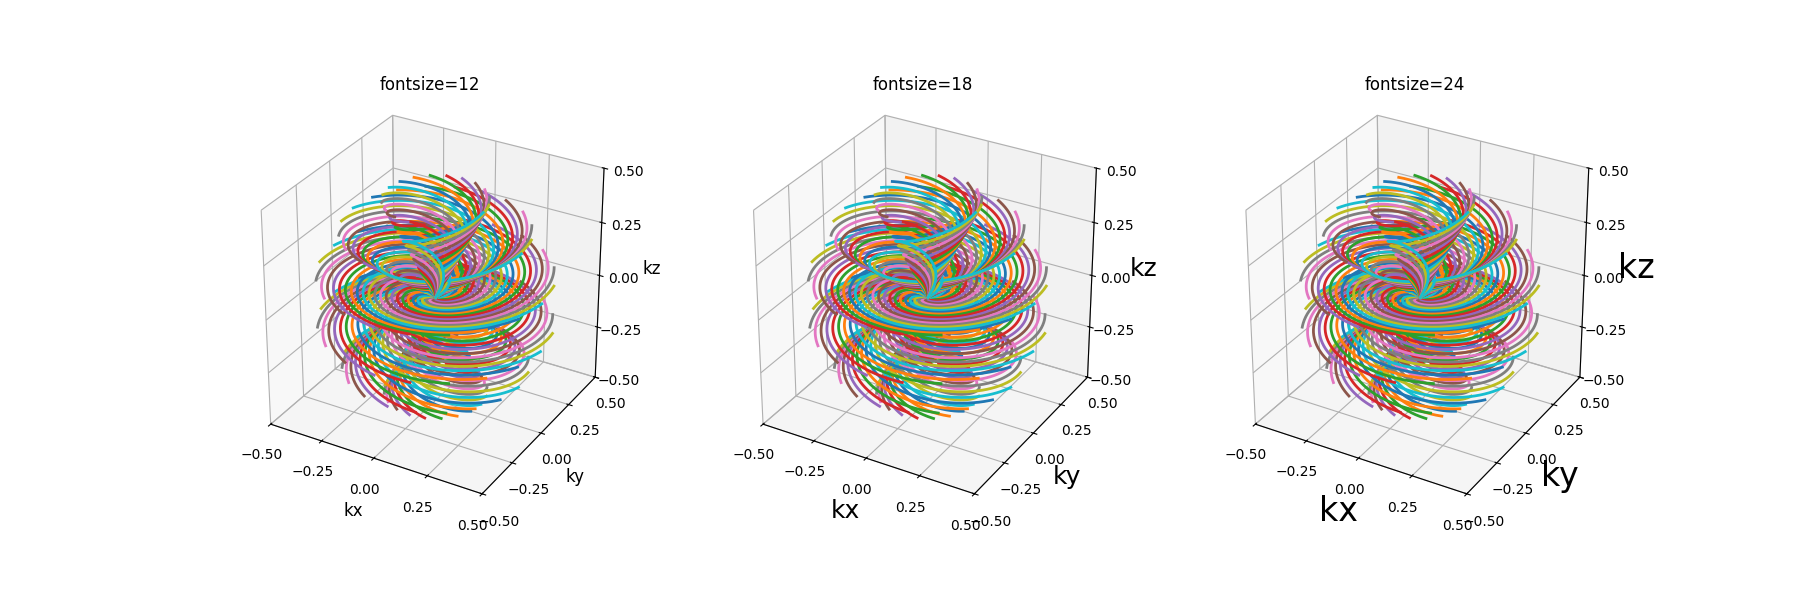
fontsize#
The fontsize parameter changes the fontsize of the labels/titles.
show_traj(traj, "fontsize", [12, 18, 24])
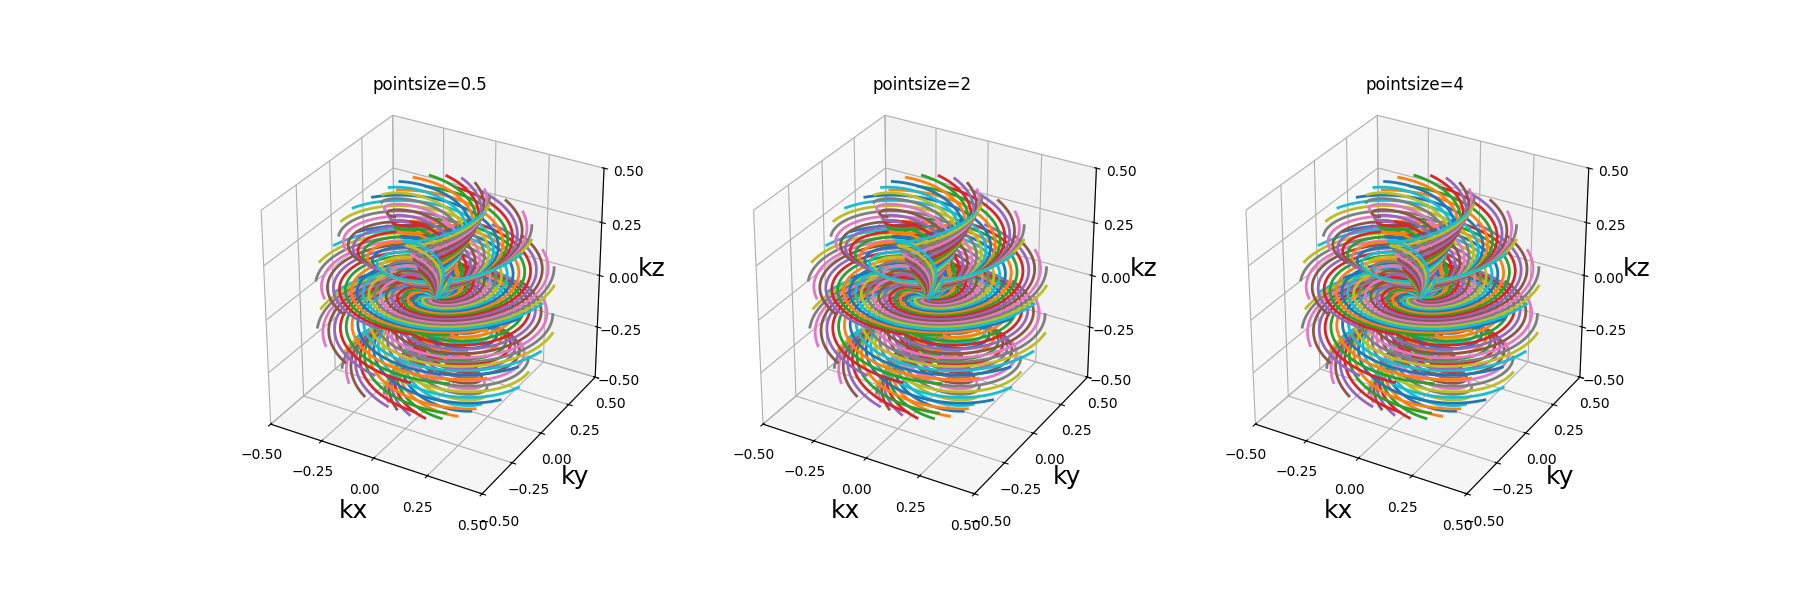
pointsize#
The pointsize parameter is used when showing the gradient constraint violations
to change the violation point sizes.
show_traj(traj, "pointsize", [0.5, 2, 4], show_constraints=True)
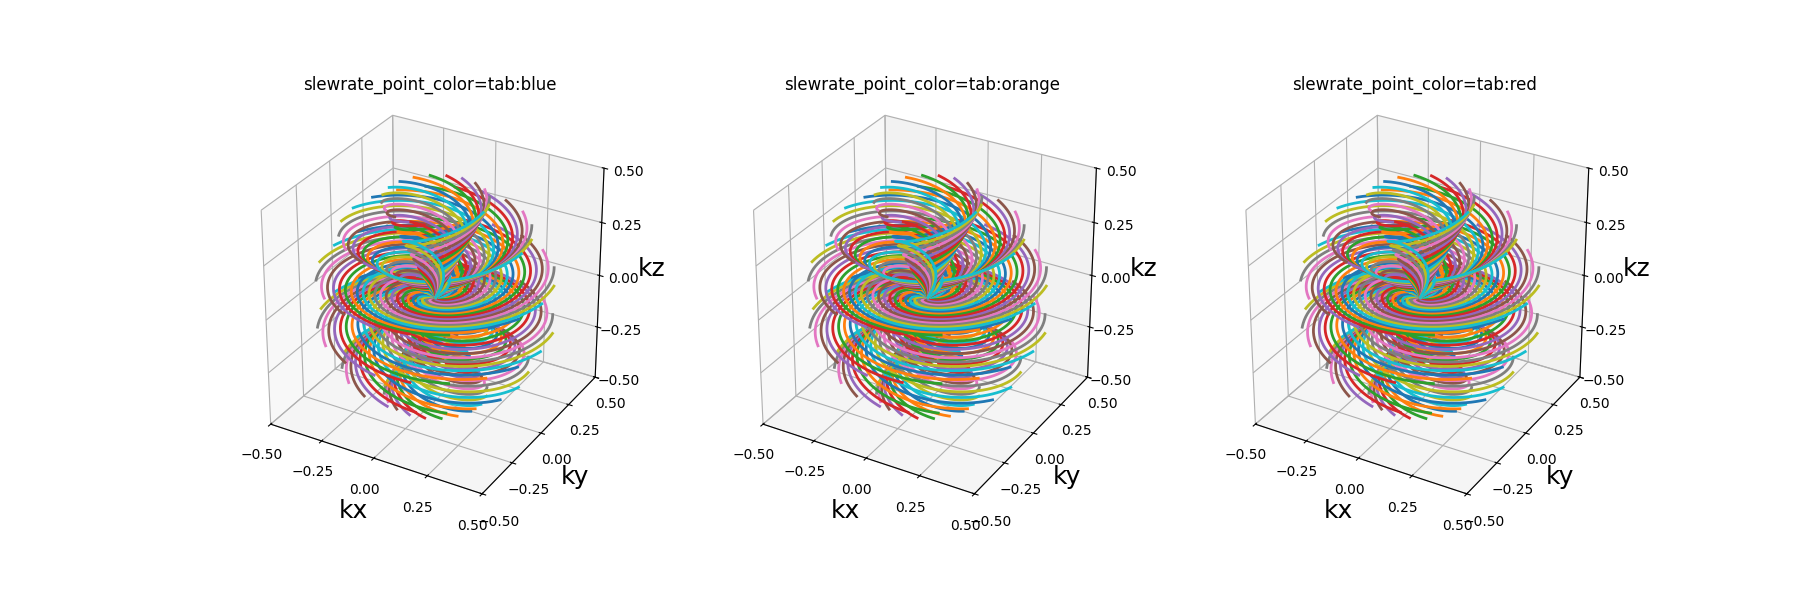
gradient_point_color and slewrate_point_color#
The gradient_point_color and slewrate_point_color parameters allows you
to change the color of the points where gradient or slew rate constraint violations
are observed.
show_traj(
    traj,
    "slewrate_point_color",
    ["tab:blue", "tab:orange", "tab:red"],
    show_constraints=True,
)
Total running time of the script: (0 minutes 6.210 seconds)